This is the registration manual for 1979 casework.
Do not under any circumstances use the information here when settling 2012 casework. This resource has been archived and is no longer being updated. As such, it contains many broken links. Much of the information contained here is obsolete or superseded.
P15 Ordnance Survey
- Former user (Deleted)
- Editor28 (Unlicensed)
GRIDFINDER
For help converting from metric plan references to National Grid references, please use Gridfinder.
15.1 HISTORY OF THE ORDNANCE SURVEY
This section of the Registers of Scotland Plans Manual is no longer available. For a history of the Ordnance Survey, please visit their website.
15.2 THE COUNTY SERIES MAP SYSTEM
The County Series system was in use up to 1945. Each diagram was surveyed as a single unit and each county had an independent COUNTY DIAGRAM on which was superimposed a grid system. The example below is the Renfrew County Diagram. For each rectangle so formed by the grid a map was produced which covered an area 6 miles by 4 miles.
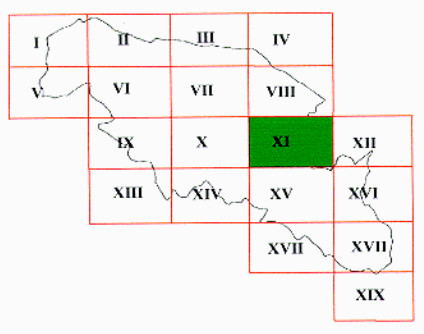
Each rectangle is identified by the County prefix ( i.e. Renfrew ) and a Roman numeral when it is published as a map at the scale of 6" to 1 mile or 1 : 10560 i.e. Renfrew XI.

Obviously the bigger or smaller the county the more or less rectangles of this size are formed.
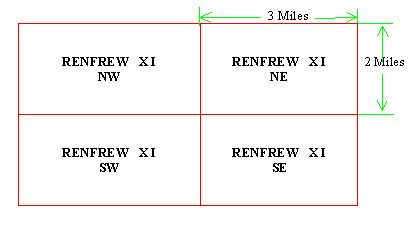
Each 6" to 1 mile map could be, but not always, sub divided into four quarters and where known as Quarter 6" maps. That is to say maps still at the 6" to 1 mile scale which were one quarter the size of the original map. The quarter being separately numbered by the addition of the suffix NE, NW, SE or SW.
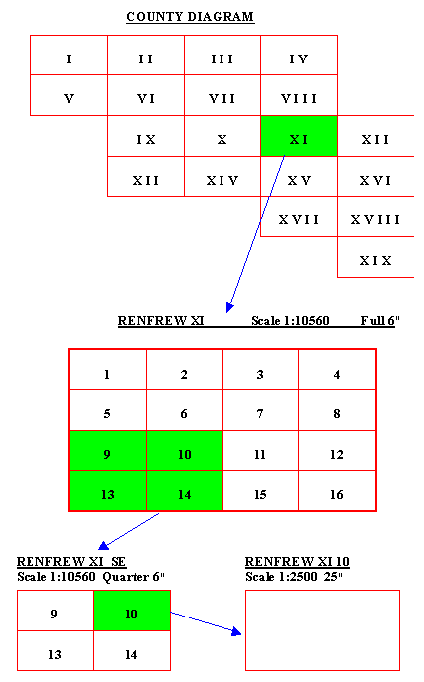
To arrive at the largest scale surveyed under the County Series system a full 6" map was broken down into smaller units covering an area of 1 1/2 miles by 1 mile at a scale of 25" to 1 mile or 1 : 2500. There are 16 of these maps to a full 6" map.
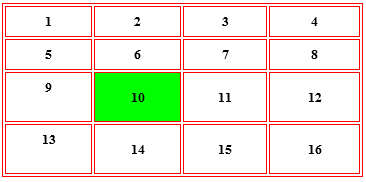
The reference for the map coloured green on the above diagram above will be Renfrew XI 10.
Breakdown of the County Series system
This system was in use up to 1945. The County Series system was replaced by the National Grid system because of the recommendation of the DAVIDSON COMMITTEE which met between 1935 - 1938.
Its replacement was recommended because of the limitations of the County Series system which included:
- Distortion at county edges making adjoining maps incompatible. Most counties at the 1/2500 scale surveys were carried out using a number of different map projections each with their own central meridians. The result was that although the greater part of the country was mapped at 1.2500 scale, it did not form a national survey but rather a number of county surveys which did not fit together at their boundaries.
- Largest scale was 1:2500 which was proving to be inadequate for recent legalisation namely the Land Registration Act (1925) and the Town and Country Planning Acts (1925).
- No house numbers were shown.
- No systematic revision for updating new development each map was update every 10 to 20 years.
- Due to each county having its own meridian there was no national referencing system.
The recommendations of the Davidson Committee included:
- The recasting of 1:2500 scale (Twenty-five inches to one mile) map series on national instead of county lines using a national projection rather than separate county projections.
- That a National Grid be superimposed on all large and small scale maps to provided one reference system for the whole country.
- That the International metre be adopted as the unit on which the system be based. (This was a very far-sighted recommendation at that time).
- That there would be a system of continuous revision for large scale maps.
- That the 1:1250 or 50" to I mile scale to be adopted for urban areas.
- That house numbers would be shown.
THE RESULT WAS THE NATIONAL GRID SYSTEM
15.3 THE NATIONAL GRID SYSTEM
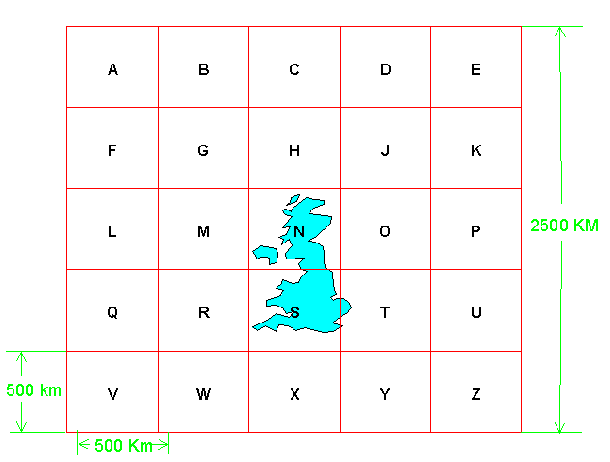
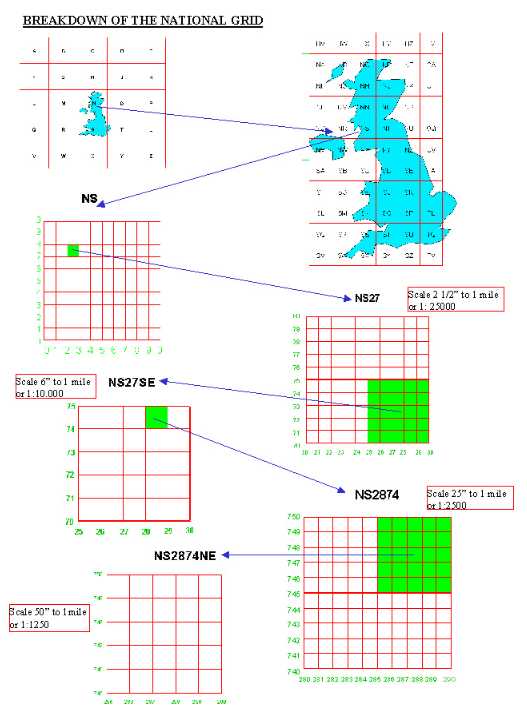
The National Grid reference system for Great Britain coincided with an existing larger military grid system with 500 kilometre squares. This system used letter references for each square. The Ordnance Survey adopted the same lettering system to provide identical referencing on both Ordnance Survey and military maps.
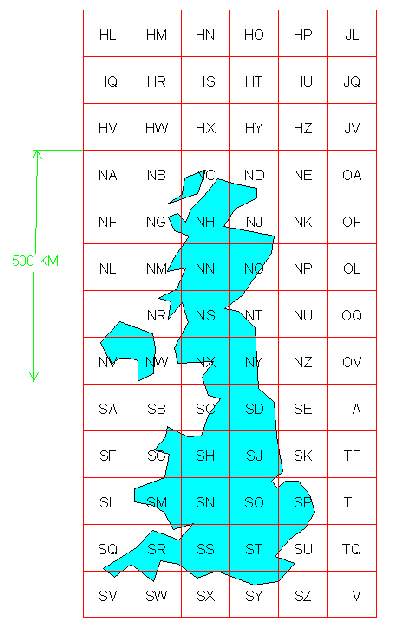
Each 500km square, i.e. N was broken down into 25 x 100km squares. Each 100km square was given an additional letter reference, i.e. NA, NE, NU, NZ. The only letter not being used from the alphabet being the letter I.
NS is a square with sides of 100km and can be further broken down into 100 x 10km squares. These 10km square maps are published at scale of 1:25 000 that is approximately 2 1/2 " to the mile.
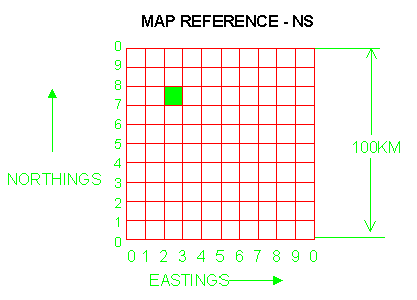
To find the reference for the 10km square shaded on map reference NS we would have to know the principles which apply to all National Grid maps which are:
- The reference is always to the SOUTH WEST corner of the square concerned.
- The first number reference is taken from left to right along the horizontal axis and is known as an EASTING. In this case it is number 2
- The second number reference is taken from bottom to top along the vertical axis and is known as a NORTHING. In this case it is number 7
Therefore the reference for the 10km square coloured green on the above diagram is NS 27
Each 10km square is further broken down into four quadrants - NS 27 NE, SE, NW and SW these are published at 1:10000 scale which is approximately 6" to 1 mile. This is the largest scale published for mountain and moorland areas of the country.
As well as being split into four quadrants NS 27 can be split into 100 x 1km squares.
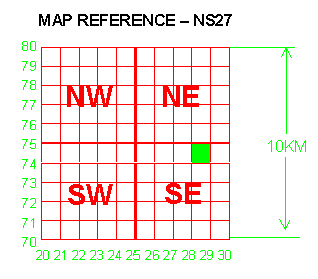
The grid reference for the 1km square shaded on the diagram above will be NS 2874. The reference is arrived at using the same Eastings and Northings principle as before and this results in a four figure grid reference. A 1km square map is published at a scale of 1:2500 or approximately 25" to 1 mile. These maps are normally published as 2 x 1km sheets and are known as double sheets. Maps published at this scale are usually for rural areas.
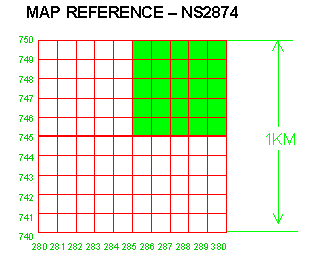
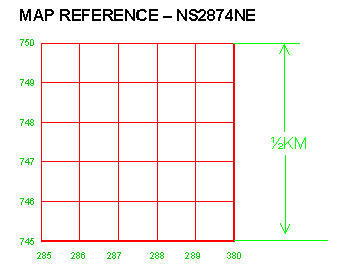
Furthermore each 1km square can be broken down into four quadrants, i.e. NS 2874 NE, SE, NW and SW covering a 1/2 km square. A 1/2 km square map is published at a scale of 1:1250 or approximately 50" to 1 mile. This is the largest scale published and is mostly used for urban areas.
It is possible to produce a 12 or more figure National Grid reference that can pinpoint an exact spot on the ground if necessary. However for Land Registry purposes we need never go beyond the reference as shown in the above diagram.
15.4 DIGITAL MAPS
Ordnance Survey first began making digital maps in 1971. At first, digital technology was used as a production tool for making traditional maps on paper. Increasingly, the digital data from which these maps have been made has found a market of its own, with the increase in demand the digitising process was accelerated and completed in 1995.
A digital map may be defined simply as a map in computer readable form. Conventional map detail ( lines, points and text ) is represented as strings of co-ordinates and is recorded on magnetic media. Once converted into this digital format, digital map data is suitable for use in a variety of applications.
A digital map can be displayed on a computer screen, merged with other graphical data, or plotted onto paper, film etc. It may be displayed or plotted at a wide range of scales and individual feature codes (layers) may be distinctively coloured, or omitted, to customise plots and screen views.
15.4.1 OS Digital Map Data Products
Due to the many different users and their diverse needs of digital mapping the O.S. provide mapping data to its customers in varying formats and products. Some of the products produced by the O.S. are –
Land-line | Large scale topographical data. |
Meridian | Mid scale vector digital map data. |
Strategi | 1/2500000 scale vector digital map. |
Superplan data | Site centered large scale data |
Base Data GB | 1/625000 scale vector digital map |
as well as map data the OS produce other products which can be used in conjunction with the map data for instance
Address point | Digitally coordinated postal address data. |
Land-Form PANORAMA | 1/50000 scale digital height data |
Land-Form PROFILE | 1/10000 scale digital height data |
We in the Agency need only concern ourselves with the large scale digital Map data family known as the "Land-Line Data" product.
LAND-LINE DATA PRODUCT - is Ordnance Survey’s established series of authoritative large-scale maps in computer readable vector form.
15.4.2 Basic Principles
The basic principles of Land-line as stated by the Ordnance Survey are:-
- Land-Line views the real world as series of point, line and text ‘features’ making up a digital map.
- Each ‘feature’ has associated geometry; this may be a single point for a symbol representing a Mile Post alongside a road, or two pairs of co-ordinates, representing each end of a straight fence.
- Each feature is a free standing entity, the data contains no pointers to logically connect or relate any feature to any other feature.
- Each ‘feature’ is classified by means of a feature code (FC). e.g. a building outline is distinguished from a fence by the feature code assigned to each feature. These feature codes are allocated as the data is captured and interpreted from the source information. A building outline will be distinguished from a wall or fence and other kinds of features by the feature code assigned to it.
Real world features included in Land-line are classified into thirty feature codes and six text categories.
Land-Line. Plus which is a premium version of Land-Line. offers a further twenty seven layers of Landscape Codes.
15.4.3 Maintenance Service
The Agency currently rents map data from the OS on an annual basis. This arrangement also includes a maintenance service which provides us with up to date replacement digital map files to reflect any physical change.
As development takes place on the ground it is surveyed and digitised. The extent of the change is measured in "Units of Change". One unit is a house and its fences, or an equivalent amount of change reckoned in length of road, area of industrial buildings etc. When sufficient change has occurred on a map, the updated digital map file is supplied under the maintenance service.
OS allow customers to tailor this service to accommodate their own specific needs by specifying the "Update Threshold" and "Update Supply Interval" required.
- The "Update Threshold" specifies the number of "Units of Change" that can accrue on a map file before a new version of the map is re-supplied.
- The "Update Supply Interval" specifies the frequency of delivery of updated information.
Our current contract provides for a standard maintenance service which re-supplies us with new map files on a monthly basis after twenty units of change have accrued. The OS administer this service and review any change through utilising the house unit count for each map file.
Related content
*
This is the registration manual for 1979 casework.
Do not under any circumstances use the information here when settling 2012 casework. This resource has been archived and is no longer being updated. As such, it contains many broken links. Much of the information contained here is obsolete or superseded.
*
The Manual is an internal document intended for RoS staff only. The information in the Manual does not constitute legal or professional advice and RoS cannot accept any liability for actions arising from its use.
Using this website requires you to accept cookies. More information on cookies.